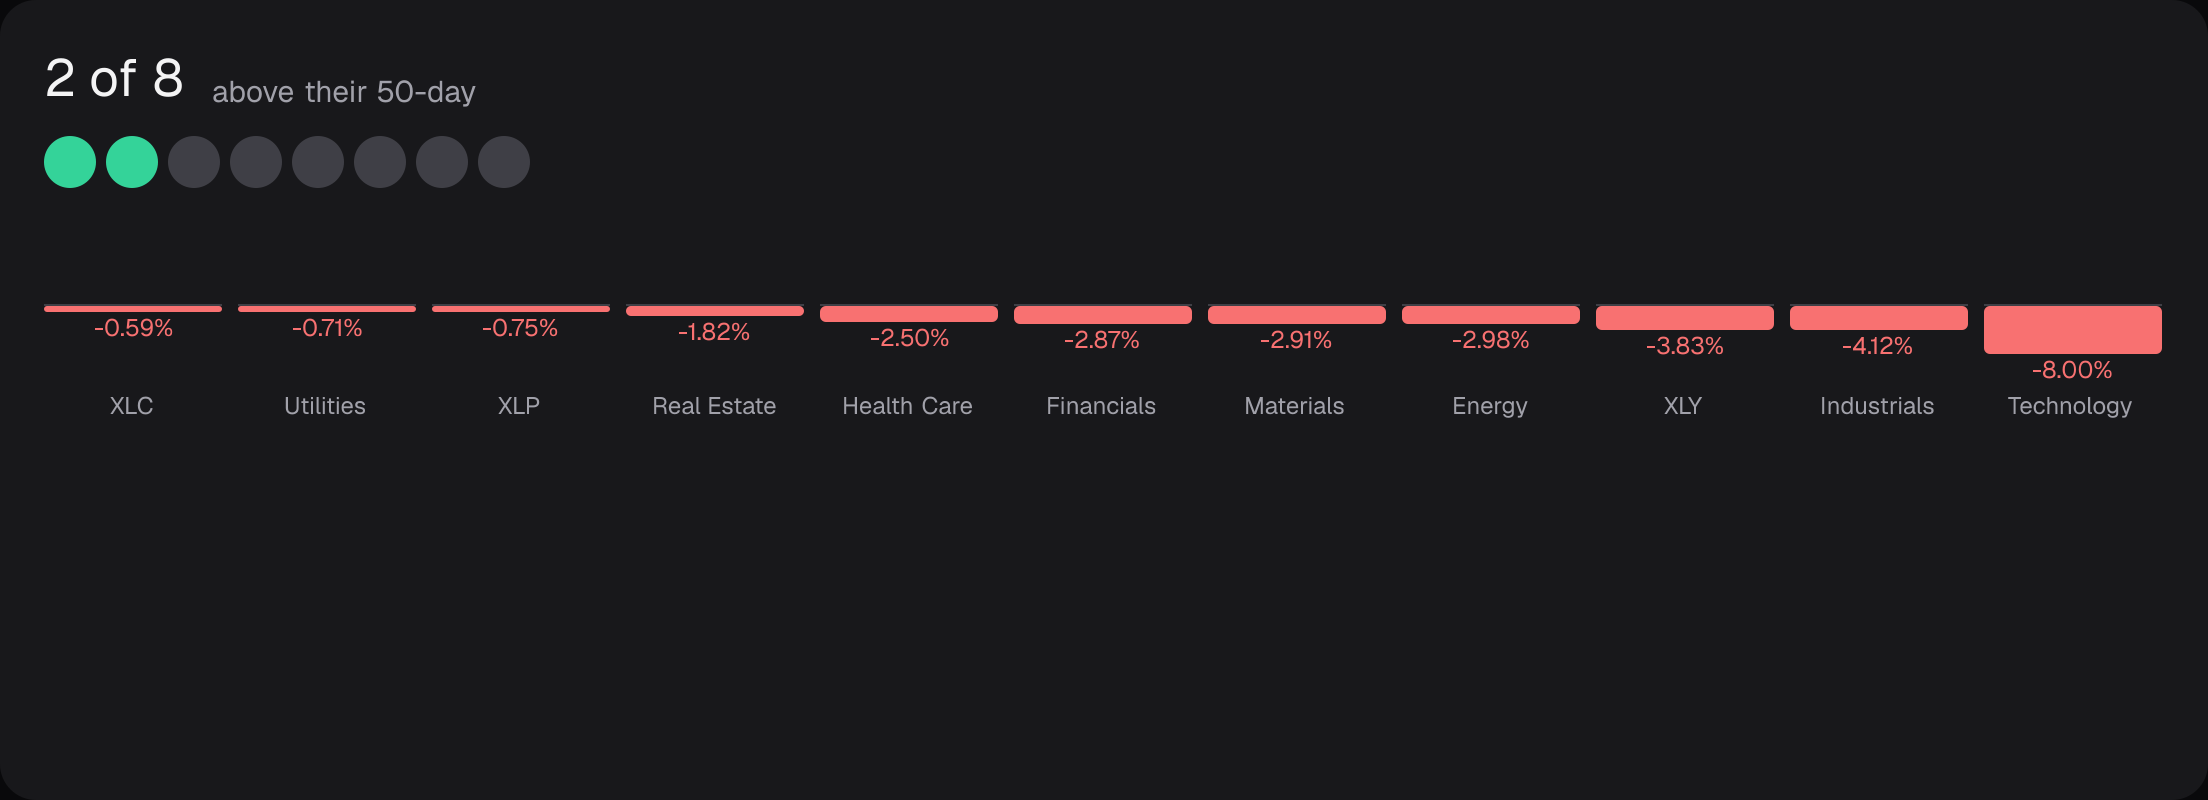
On November 5, 2 of the 8 tracked indices were above their 50-day average.
Market Anatomy as drawn for the share card of Thursday, November 5, 2026. The same picture is on its share card.
Today's standout, the names around it and how it sits against the market. Tap a name, a sector or an index to move.
Today's relationship
Lumentum
Lumentum made the largest move with a cause on record.
Lumentum
LITE · close 509.7
0.08%
▼ -18.68%1dMoved with XLK -8.00%
Moved 18.7%, at or above the 3% floor for this strip
Lumentum, stored closes
Lumentum-38.3%
Stored daily closes.
Nearest connections
Stored cause
Technology (XLK) moved -8.00% the same way, which accounts for all but 10.68 points of the move.
Index membership
In the S&P 500 (holdings file dated 2026-11-04): weight 0.08%, rank 213 of 503.
Sector
Technology. From the S&P 500 holdings file dated 2026-11-04. The Technology fund moved -8.00%, 11 of 11 sectors.
Movers in the same sector
Same sector, same session, not a measured link.
Against the market
Lumentum moved -18.68% on the session, 14.32 points behind the S&P 500.
Its sector
Largest Technology names in the S&P 500, file dated 2026-11-04
AVGOBroadcomweight only2.33% of the S&P 500
CSCOCisco Systemsweight only0.62% of the S&P 500
Indices
Weights, ranks and sectors come from the stored holdings files: S&P 500 (dated 2026-11-04), Dow 30 (dated 2026-11-04), S&P MidCap 400 (dated 2026-11-04), S&P SmallCap 600 (dated 2026-11-04). A sector taken from the SEC SIC code is mapped by us and says so beside it.
The day's board
Market participation
25%
2 of 8 tracked indices above their 50-day average
Counted over ^GSPC, ^IXIC, ^DJI, ^RUT, ^FTSE, ^N225, ^GDAXI, 000001.SS. This is a reading across whole market indices, not a count of the companies inside any one of them.
Today's movers
Sectors, one session
Each bar is scaled against the widest move of the day. Tap a sector to see its largest names.
Key takeaways
1
The S&P 500 fell 4.36% while the equal weight fund fell 2.89%, a gap of -1.46 points. The average constituent held up better than the index, so the weakness was concentrated in larger names.
2
Only 2 of 8 tracked indices sit above their 50-day average, down from 4 last time, while the VIX rose 67.25% to 27.78. Breadth and the volatility reading both point to a broad risk-off session.
3
Technology fell 8.00% against 0.59% for Communication Services, a gap of 7.41 points. Industrials and Consumer Discretionary also fell more than the market, so the weakness was not even across sectors.
4
Lumentum, Micron, AMD, Marvell and Dell each fell further than XLK, by 6.89 to 10.68 points. Their coded cause is the same Technology move, so the chip selloff was larger than the sector fund itself.
The full day: index block, sentiment, every mover and the open questions
7,353.73▼ -4.36%1d
Capitalisation weighted, so a move in the largest companies moves it more than a move in the smallest.
the last 40 stored closes, scaled to their own range
24,315.00▼ -5.52%1d
Every Nasdaq listing, weighted by capitalisation and heavy in technology.
51,523.06▼ -3.44%1d
Thirty names weighted by price rather than by capitalisation, so it can disagree with the S&P for arithmetic reasons alone.
2,729.89▼ -4.45%1d
Small capitalisation names. Read against the S&P, it is the size half of how broad a day was.
216.87▼ -2.89%1d
The same five hundred companies weighted equally, so the largest names count no more than the smallest. Read against the cap-weighted index, the gap is how much of the day belonged to the biggest companies.
Cap weight against equal weight-1.46pp
The equal-weighted index outran the cap-weighted one, so the session was broader than the headline index makes it look.
Sentiment
Sentiment composite
23▼ -39.22%1d
This system's own composite of up to seven stored inputs, 0 (extreme fear) to 100 (extreme greed), computed after each close; not CNN's index (work item #699). Context for whether sentiment confirms the tape or contradicts it.
28.18▲ +69.66%1d
Expected thirty day volatility from S&P 500 options. Rising with the index is the contradiction worth seeing.
Open questions
Why did Iren fall?-16.95%
Read for this move: 1 stored story naming Iren, its filings and corporate actions, over the 7 days to 2026-11-05.
Why did Twist Bioscience fall?-15.41%
Read for this move: the stored stories naming Twist Bioscience, its filings and corporate actions, over the 7 days to 2026-11-05.
Why did Vicor fall?-15.07%
Read for this move: the stored stories naming Vicor, its filings and corporate actions, over the 7 days to 2026-11-05.
Built in code from the movers whose evidence did not resolve, so no written summary can shorten this list.
Today's key movers
-18.68%
LITE 509.7
Moved with XLK -8.00%
Moved 18.7%, at or above the 3% floor for this strip
-17.46%
MU 656.39
Moved with 12 peers
Moved 17.5%, at or above the 3% floor for this strip
-17.26%
AMD 404.4
Moved with 12 peers
Moved 17.3%, at or above the 3% floor for this strip
-16.95%
IREN 18.03
14.1 pts behind XLF
Read for this move: 1 stored story naming Iren, its filings and corporate actions, over the 7 days to 2026-11-05.
Moved 17.0%, at or above the 3% floor for this strip
-16.43%
MRVL 133.55
Moved with XLK -8.00%
Moved 16.4%, at or above the 3% floor for this strip
-15.41%
TWST 120.61
12.9 pts behind XLV
Read for this move: the stored stories naming Twist Bioscience, its filings and corporate actions, over the 7 days to 2026-11-05.
Moved 15.4%, at or above the 3% floor for this strip
-15.07%
VICR 135.1
10.9 pts behind XLI
Read for this move: the stored stories naming Vicor, its filings and corporate actions, over the 7 days to 2026-11-05.
Moved 15.1%, at or above the 3% floor for this strip