Commodity Explorer, Monday, November 9, 2026
Published Nov 9, 2026, 4:19 PM ET
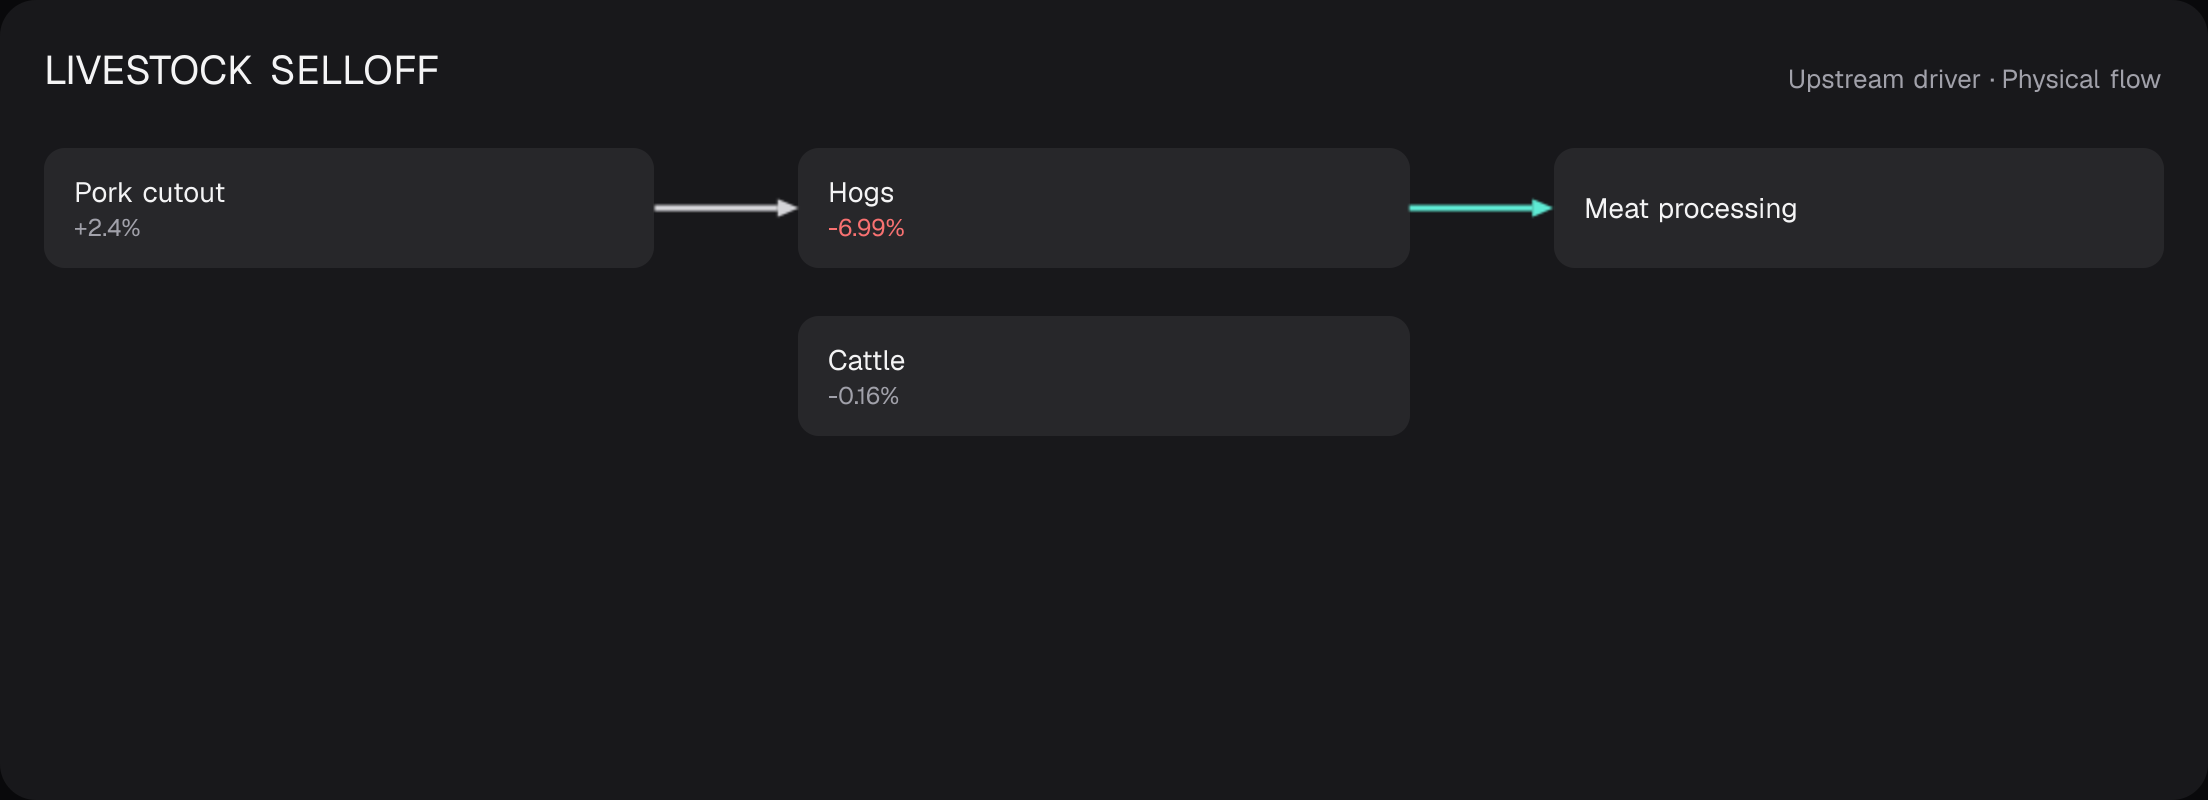
On November 9 Broad Commodities (DBC) fell 1.8%. The lead story on the diagram is LIVESTOCK SELLOFF, traced through 4 steps.
Commodity Explorer as drawn for the share card of Monday, November 9, 2026. The same picture is on its share card.
What is moving inside the physical commodity economy, why it may be moving, and where the effect goes next. Tap a commodity to move. Every move here is measured between two stored daily closes, so the reading belongs to a session rather than to a time of day.
Colour marks direction only. A commodity rising is a cost to whoever buys it and revenue to whoever sells it, so nothing here is drawn as good or bad news.
Today's relationship
Lean Hogs
The desk's picture of the day is built around Lean Hogs.
Pork at the barn. Also fed on corn and soybean meal.
- Hogs-37.9%
Stored daily closes.
2 of 2 livestock names moved today, the largest being Hogs at +4.39%. Divergence is the relationship worth reading here.
The hog drop sits beside a firmer pork carcass cutout in the latest USDA report, so wholesale pork value did not fall with the futures. Cattle barely moved.
Divergence. Cattle against hogs: +1.00% against +4.39% today, and the spread between them sits 2.4 standard deviations from its own average over the last 60 stored sessions. Both eat corn and both sell into meat processing, so they part company for reasons inside their own herds.
Stored connections, each labelled by what it is. Only a Measured line is read as a driver.
Hog net carcass price 63.45 USD per cwt for 2026-11-09, -1.67% on the prior published day (2026-11-06).
Packer margin proxy: the pork cutout less the net carcass price, 7.36 USD per cwt for 2026-11-09, against 6.12 on 2026-11-06. A proxy, because both are carcass prices per hundredweight.
USDA AMS daily reports, as last published: context and not a same-session cause.
Corn, a feed input: -0.51% on the session and -9.06% over the month.
Soybeans, standing in for soybean meal, which is not stored: -0.57% on the session and -8.19% over the month.
Hogs to corn price ratio of the two stored front months: 0.1272, at the 0th percentile of its last 251 stored sessions, -13.5% over the month. A futures ratio, not the USDA cash ratio.
An input cost is context beside the move and not a measured cause of it.
Managed-money net is -18.2% of open interest as of Tuesday 2026-11-03, down 1.4 points on the week: an ordinary week by its own history. Positioning, never a physical driver.
CFTC report, published weekly: context and not a same-session cause.
Top to bottom: Upstream connections, Commodity, Where it goes
- Physical flow
- Upstream driver
- Divergence
Cattle against hogs: Diverging, 2.4 standard deviations from its own average over the last 60 stored sessions. Both eat corn and both sell into meat processing, so they part company for reasons inside their own herds. Cattle +1.00% against Hogs +4.39% on the session.
Consumer Staples fund (XLP): +0.90% on 2026-11-09. Meat packers and food makers sit in this fund. A sector fund stands for the nearest listed buyers and is not a measured link.
Named holdings of the fund: Tyson Foods (TSN) 0.98% of the fund; Hormel Foods (HRL) 0.37% of the fund.
The dollar index moved +0.65% on the session (close of 2026-11-06). Macro context, not tested against this market.
The downstream column stops at the first physical use. Where a cost travels after that, through industries and equity sectors, is Sector Supply Lines' subject and not this page's.
Upstream
Pairs
Downstream
Feeds on
Trades against
Who buys it
Open elsewhere
Every commodity
Energy
Metals
Grains
Livestock
Softs
Broad basket
- 1
Hogs fell sharply while the USDA pork cutout rose in the latest report, so futures and wholesale pork value moved apart. The feed guard refused the cattle against hogs spread after its one-session jump.
- 2
Gold and silver both fell on a firmer dollar index, and their spread sits 2.0 standard deviations from its 60 session average, while copper's gap with gold closed back into range.
- 3
Crude, gasoline and diesel all showed spreads 1.6 to 1.7 standard deviations from their 60 session averages, a refining margin shift rather than a supply story.
What it costs to move it
- Long-distance truckload219.38+4.55%What long-haul truckload carriers actually charged. This is the rate side of the trucking path, where the diesel price is the fuel side.index, published monthly, observation of 2026-09-01, measured against 2026-08-01. US Bureau of Labor Statistics producer price indexes, retrieved from FRED.
- Truck transportation, all222.21+3.66%The broader trucking read. It and the truckload index moving apart separates the long-haul contract market from everything else on the road.index, published monthly, observation of 2026-09-01, measured against 2026-08-01. US Bureau of Labor Statistics producer price indexes, retrieved from FRED.
- Freight arrangement136.40.00%The intermediary's price. It typically moves ahead of the carrier indexes, because a broker reprices a load in a day and a contract carrier reprices at renewal.index, published monthly, observation of 2026-09-01, measured against 2026-08-01. US Bureau of Labor Statistics producer price indexes, retrieved from FRED.
- Line-haul railroads272.4+0.04%The billed-rate read on rail, which the weekly grain shuttle rate above is the grain-specific and faster-moving half of.index, published monthly, observation of 2026-09-01, measured against 2026-08-01. US Bureau of Labor Statistics producer price indexes, retrieved from FRED.
- Rail freight, commodity basis159.18+0.04%A second rail rate built a different way. Where it and the line-haul industry index agree, the rail reading is not an artefact of one construction.index, published monthly, observation of 2026-09-01, measured against 2026-08-01. US Bureau of Labor Statistics producer price indexes, retrieved from FRED.
- Shuttle rail, grain128-1.54%What a grain shipper actually pays for a shuttle railcar, indexed against the 2017 average of $4,833.14 a car.index, 2017 = 100, published weekly, observation of 2026-11-04, measured against 2026-10-28. USDA Agricultural Marketing Service, Grain Transportation Report.
- Illinois River barge, grain221.39-0.96%The inland waterway leg between the Corn Belt and the Gulf export elevators, which is the cheapest and the most weather-exposed of the three inland modes.index, 2017 = 100, published weekly, observation of 2026-11-04, measured against 2026-10-28. USDA Agricultural Marketing Service, Grain Transportation Report.
- US Gulf to Japan, grain vessel190.06-2.29%The seaborne leg of a Gulf export cargo. A grain rate on a grain route, and not a general dry bulk or container rate.index, 2017 = 100, published weekly, observation of 2026-11-04, measured against 2026-10-28. USDA Agricultural Marketing Service, Grain Transportation Report.
- Pacific Northwest to Japan, grain vessel187.65+2.60%The shorter export route, which is why its level sits well under the Gulf one and why the two parting company is a routing story rather than a freight one.index, 2017 = 100, published weekly, observation of 2026-11-04, measured against 2026-10-28. USDA Agricultural Marketing Service, Grain Transportation Report.
- Deep sea freight534.8+0.39%The only seaborne rate here that is not grain-specific. Monthly and indexed, so it carries the direction of ocean freight and never a quotable rate.index, published monthly, observation of 2026-09-01, measured against 2026-08-01. US Bureau of Labor Statistics producer price indexes, retrieved from FRED.
USDA's rates cover grain and refrigerated produce, which makes them a directional read on US inland bulk freight rather than a rate for metals, energy or containers. The BLS indexes are national and monthly, so they carry direction and not a quotable price.
No free public container spot index, dry bulk index or tanker rate is published, so a containerised leg and a seaborne bulk leg outside grain carry the diesel price as the cost of the fuel and never as a rate.
Freight rates for grain are published by the USDA Agricultural Marketing Service in its weekly Grain Transportation Report. This product uses the FRED® API but is not endorsed or certified by the Federal Reserve Bank of St. Louis.
Across the complexes, macro context and what was refused
- Inflation pressure8 of the 10 names moving in this theme fell today, the largest being Brent at -5.85%. That is consistent with easing input-cost pressure across energy, grains and softs together.from Brent, WTI, Gasoline, Diesel, Corn, Wheat, Soybeans, Cocoa
- Industrial demand3 of the 4 names moving in this theme rose today, the largest being Platinum at +2.74%. That is consistent with firmer industrial and manufacturing demand, though copper on its own is not a growth indicator.from Copper, Platinum, Palladium
- Haven demand2 of the 2 names moving in this theme rose today, the largest being Silver at +1.47%. That is consistent with firmer haven and monetary demand, which gold alone does not establish.from Gold, Silver
- Transportation fuel cost3 of the 3 names moving in this theme fell today, the largest being Gasoline at -4.53%. That is consistent with falling transport FUEL costs, which is a different number from a billed freight rate and is measured here from fuel prices alone.from WTI, Gasoline, Diesel
Quiet today: Grains, nothing moved more than 0.57% and no pair in it is outside its own recent range.
- US Dollar Index102.28+0.65%
- 10Y Treasury4.86%+0.45%
- Sentiment composite24+3.04%
Secondary on purpose. These interpret the commodities above; they do not lead them.
Reading the diagrams
- Physical flowOne is physically transformed into, or directly contributes to, the other.
- DivergenceRelated markets behaving differently by more than their own recent history accounts for.
- ConvergenceA difference that had opened between two related markets is closing again.
- ConfirmationRelated markets moving in broadly the same direction.
- SubstitutionThe two can stand in for one another in some physical or economic use.
- Common driverBoth are being read against the same stored upstream measurement.