Global Macro Dashboard, Monday, November 2, 2026
Published Nov 2, 2026, 4:20 PM ET
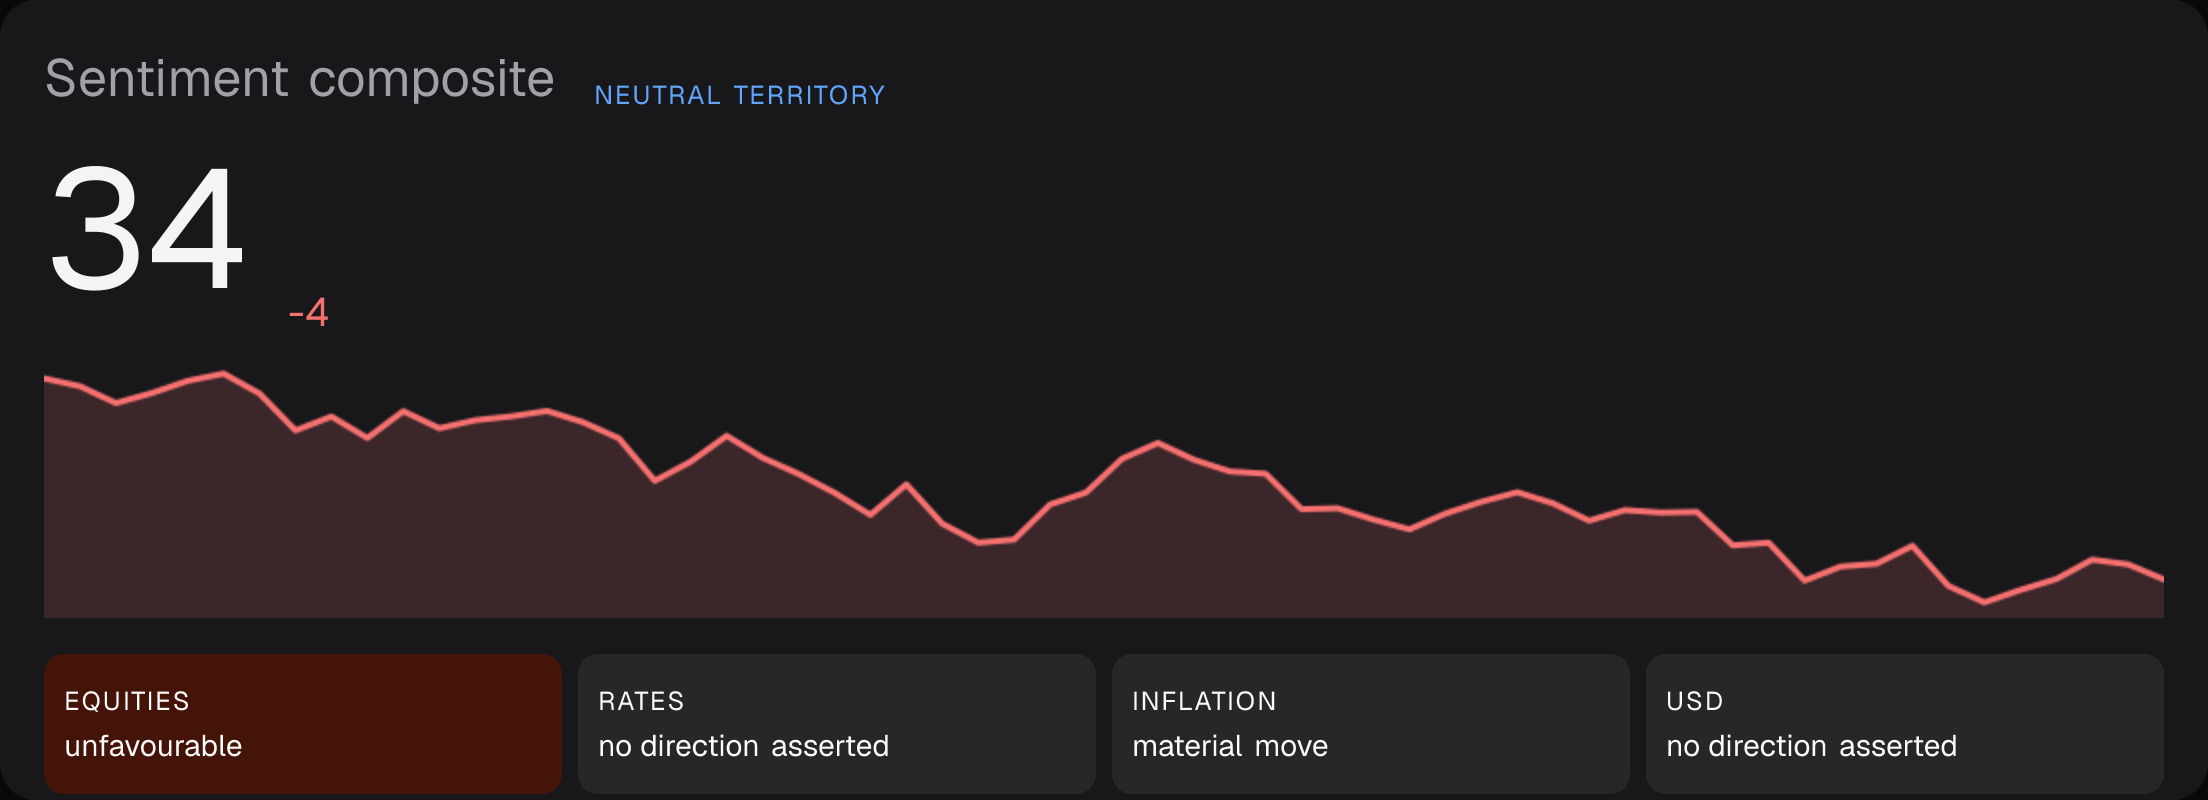
On November 2 Sentiment composite stood at 34, down 4, which reads as neutral territory. On the heat map, equities scored unfavourable, rates showed no clear direction, inflation made a material move and the dollar showed no clear direction.
Global Macro Dashboard as drawn for the share card of Monday, November 2, 2026. The same picture is on its share card.
Key drivers, broader context, clearer decisions. Each macro reading carries its own observation period, which is printed on the reading.
Today's relationship
Dollar Index
The desk's picture of the day is built around Dollar Index.
What we measured
A stronger dollar tightens conditions abroad and cheapens imports at home. Neither is favourable on its own.
The Dollar Index eased to 101.77 from 101.88.
One step away
The question
Is the lower 10-year yield and the softer dollar enough to cushion the S&P 500, or is rising volatility outweighing them while the Fed funds rate stays unchanged?
Tap a card or pill to move it to the centre.
What it means
Rates and equities moved in the same direction today, with the 10-year yield lower at 4.89% and the S&P 500 down 0.51%, so lower yields did not lift stocks. The dollar slipped only 0.11%, which gives little sign that currency moves are driving either market. The Fed funds rate is unchanged at 3.88% as of 2026-10-29, so policy is not the source of today's moves.
Conclusion
The readings do not show lower yields or a softer dollar cushioning the S&P 500 today, since equities fell alongside both.
Macro heat map
Rates, USD, Commodities and Inflation are never green and never red: each is favourable for one part of the economy and costly to another, so those cells show only whether the move was material.
The whole board
This system's own composite of up to seven stored inputs, 0 (extreme fear) to 100 (extreme greed), not CNN's index (work item #699). Extreme greed is not favourable and extreme fear is not unfavourable. Both ends of the bands (25 and 75, the cut points CNN publishes) are flagged; the middle is neutral.
Inflation
Year over year, read against the Federal Reserve's two percent goal. Moving away from it in either direction is the material move, so a fall is not automatically favourable.
Excluding food and energy. Same distance-to-target rule as headline CPI.
The price index the Federal Reserve's two percent goal is actually written against, which CPI is not. Same distance-to-target rule as the CPI tiles: moving away from two percent in either direction is the material move.
Excluding food and energy. The single number most often described as the one the Federal Reserve watches.
Labour
Half of the Federal Reserve's dual mandate. A rise is unfavourable. The Sahm rule reads a 0.5 point rise off the recent low as a recession marker in real time.
Total jobs on non-farm payrolls, in thousands. The monthly change is the print that moves markets; the level is here so the change has something to sit on.
Average hourly pay across all private employees. A rise is a gain for households and a cost that feeds inflation, so no favourable direction is asserted here.
Rates and policy
The effective overnight rate, which is where policy actually is. A policy setting is neither favourable nor unfavourable by itself, so this tile takes no colour.
Ten year minus two year. The re-steepening after an inversion has historically coincided with the downturn rather than the inversion itself, so a rising spread is not favourable.
Growth
Real gross domestic product, year over year, published quarterly. It is the slowest reading on this page by a wide margin, so it carries no daily, weekly or monthly change.
The Federal Reserve Bank of Philadelphia's monthly survey of manufacturers in its own district: the share reporting higher activity minus the share reporting lower. Above zero is expansion in that district. One region, not the national ISM index, which is licensed and not shown.
Equities
- 7,541.40-0.51%
- 25,164.31-1.07%
- 51,983.98+0.41%
- 2,805.88-0.21%
- 10,761.30+0.29%
- 25,981.09+0.63%
- 63,081.86-0.33%
| Instrument | Close | 1D |
|---|---|---|
| 7,541.40 | -0.51% | |
| 25,164.31 | -1.07% | |
| 51,983.98 | +0.41% | |
| 2,805.88 | -0.21% | |
| 10,761.30 | +0.29% | |
| 25,981.09 | +0.63% | |
| 63,081.86 | -0.33% |
Commodities
No green or red here. A rise in any of these is a gain for one side of the economy and a cost to the other, so the page shows direction and size and asserts no favourable direction.
- 96.46-7.36%
- 3,969.60+1.81%
- 6.54+1.32%
- 2.86-1.45%
- 448.25+0.11%
- 606.50+0.50%
| Instrument | Close | 1D |
|---|---|---|
| 96.46 | -7.36% | |
| 3,969.60 | +1.81% | |
| 6.54 | +1.32% | |
| 2.86 | -1.45% | |
| 448.25 | +0.11% | |
| 606.50 | +0.50% |
Major currency pairs
No green or red here. Every pair is one currency against another, so a move is favourable for one side and costly to the other, and a stronger dollar tightens conditions abroad while it cheapens imports at home. The page shows direction and size and asserts no favourable direction.
- 1.1157-0.23%
- 157.677-0.08%
- 1.3386+0.05%
- 0.7029+0.03%
- 1.3970-0.12%
- 0.8248+0.14%
| Instrument | Close | 1D |
|---|---|---|
| 1.1157 | -0.23% | |
| 157.677 | -0.08% | |
| 1.3386 | +0.05% | |
| 0.7029 | +0.03% | |
| 1.3970 | -0.12% | |
| 0.8248 | +0.14% |