Market Pulse Overview, Friday, November 13, 2026
The state of the market on one screen: what led, what pulled against it, and where to look next.
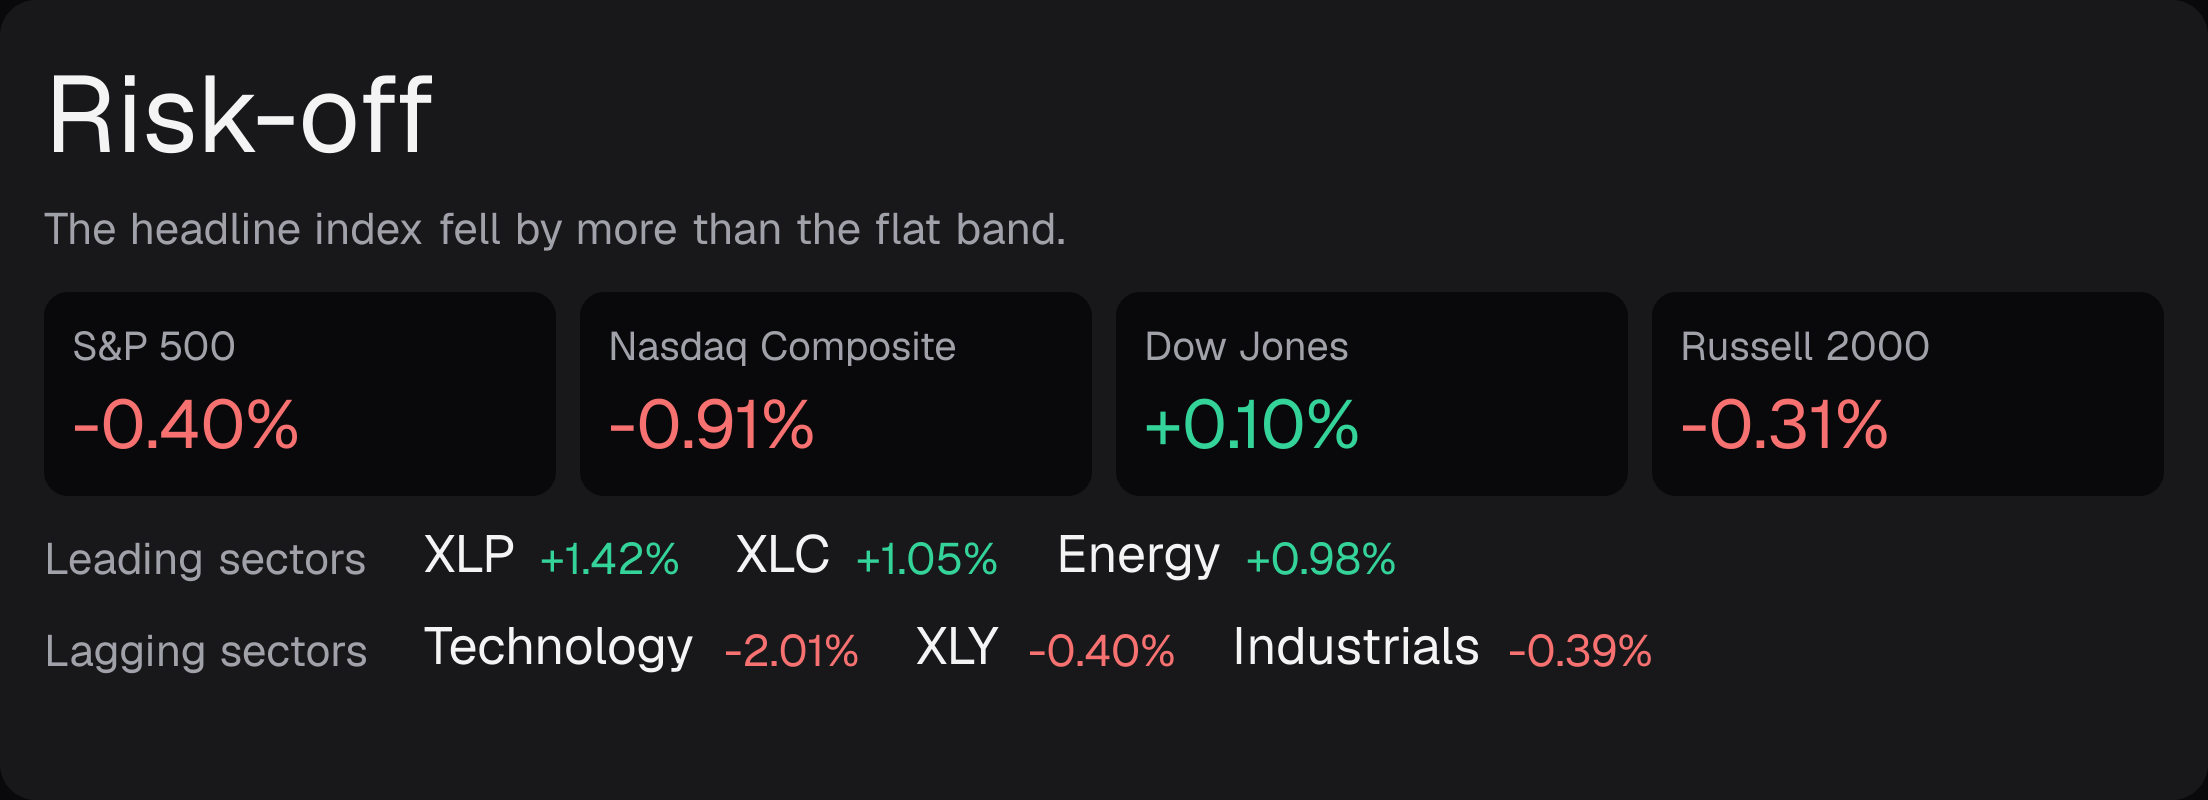
On November 13 the market read was risk-off. The S&P 500 fell 0.40%, the Nasdaq Composite fell 0.91%, the Dow Jones rose 0.10% and the Russell 2000 fell 0.31%; Consumer Staples led the sectors, up 1.42%, and Technology lagged, down 2.01%.
The reading as it stood on Friday, November 13, 2026, stored when it was drawn. The same picture is on its share card. The live reading is on the latest page.
The S&P 500 by sector and company
Session of Friday, November 13, from the holdings files published the next morning
On Friday, November 13, the S&P 500 fell 0.40%; Technology took 0.61 percentage points off it, and AMD alone took 0.13 percentage points off it.
Technology21 of 76 rose, 35.6% of the index-1.70%
- AAPLAPPLE INC+0.39%8.0% of the index
- NVDANVIDIA CORP-2.01%6.0% of the index
- MSFTMICROSOFT CORP+0.17%6.0% of the index
- AVGOBROADCOM INC-4.76%2.5% of the index
- MUMICRON TECHNOLOGY INC-2.52%1.3% of the index
- AMDADVANCED MICRO DEVICES-8.75%1.3% of the index
And 70 more: 19 rose and 51 fell, 10.5% of the index together.
Open Technology on the boardFinancials70 of 76 rose, 12.6% of the index+0.81%
- BRK.BBERKSHIRE HATHAWAY INC CL B+0.53%1.7% of the index
- JPMJPMORGAN CHASE + CO+0.99%1.4% of the index
- VVISA INC CLASS A SHARES+1.30%1.1% of the index
- MAMASTERCARD INC A+1.32%0.8% of the index
- BACBANK OF AMERICA CORP+1.01%0.5% of the index
- GSGOLDMAN SACHS GROUP INC+0.33%0.4% of the index
And 70 more: 64 rose and 6 fell, 6.7% of the index together.
Open Financials on the boardHealth Care43 of 60 rose, 10.5% of the index+0.58%
- LLYELI LILLY + CO+1.26%1.8% of the index
- JNJJOHNSON + JOHNSON+0.79%1.1% of the index
- ABBVABBVIE INC+0.20%0.8% of the index
- UNHUNITEDHEALTH GROUP INC+0.58%0.6% of the index
- MRKMERCK + CO. INC.+0.55%0.6% of the index
- TMOTHERMO FISHER SCIENTIFIC INC+0.11%0.4% of the index
And 54 more: 37 rose and 17 fell, 5.3% of the index together.
Open Health Care on the boardConsumer Discretionary28 of 47 rose, 9.5% of the index-0.44%
- AMZNAMAZON.COM INC-0.29%4.0% of the index
- TSLATESLA INC-1.82%1.7% of the index
- HDHOME DEPOT INC+0.13%0.5% of the index
- MCDMCDONALD S CORP-0.60%0.3% of the index
- TJXTJX COMPANIES INC-1.18%0.2% of the index
- LOWLOWE S COS INC+0.12%0.2% of the index
And 41 more: 26 rose and 15 fell, 2.6% of the index together.
Open Consumer Discretionary on the boardCommunication Services13 of 22 rose, 8.9% of the index+0.26%
- GOOGLALPHABET INC CL A-0.98%2.7% of the index
- METAMETA PLATFORMS INC CLASS A+2.90%2.2% of the index
- GOOGALPHABET INC CL C-0.96%2.1% of the index
- NFLXNETFLIX INC-0.86%0.4% of the index
- DISWALT DISNEY CO/THE+0.63%0.3% of the index
- VZVERIZON COMMUNICATIONS INC-0.41%0.3% of the index
And 16 more: 11 rose and 4 fell, 1.0% of the index together.
Open Communication Services on the boardIndustrials37 of 83 rose, 8.2% of the index-0.41%
- GEGENERAL ELECTRIC+0.29%0.5% of the index
- CATCATERPILLAR INC-0.84%0.4% of the index
- RTXRTX CORP+0.11%0.4% of the index
- GEVGE VERNOVA INC-1.87%0.3% of the index
- UNPUNION PACIFIC CORP-0.58%0.3% of the index
- DEDEERE + CO-0.77%0.3% of the index
And 77 more: 35 rose and 41 fell, 6.0% of the index together.
Open Industrials on the boardConsumer Staples29 of 33 rose, 5.2% of the index+1.38%
- WMTWALMART INC+1.51%0.9% of the index
- COSTCOSTCO WHOLESALE CORP+1.28%0.8% of the index
- PGPROCTER + GAMBLE CO/THE+1.06%0.6% of the index
- KOCOCA COLA CO/THE+1.86%0.6% of the index
- PMPHILIP MORRIS INTERNATIONAL+1.17%0.5% of the index
- PEPPEPSICO INC+2.24%0.3% of the index
And 27 more: 23 rose and 4 fell, 1.6% of the index together.
Open Consumer Staples on the boardEnergy18 of 21 rose, 3.6% of the index+0.72%
- XOMEXXONMOBIL HOLDINGS CORP-0.15%1.1% of the index
- CVXCHEVRON CORP+1.64%0.7% of the index
- COPCONOCOPHILLIPS+0.92%0.3% of the index
- MPCMARATHON PETROLEUM CORP+0.44%0.2% of the index
- VLOVALERO ENERGY CORP+1.30%0.2% of the index
- PSXPHILLIPS 66+0.76%0.2% of the index
And 15 more: 13 rose and 2 fell, 1.1% of the index together.
Open Energy on the boardUtilities24 of 31 rose, 2.1% of the index+0.43%
- NEENEXTERA ENERGY INC-0.20%0.3% of the index
- SOSOUTHERN CO/THE+0.39%0.2% of the index
- DUKDUKE ENERGY CORP+1.30%0.2% of the index
- CEGCONSTELLATION ENERGY-0.93%0.1% of the index
- AEPAMERICAN ELECTRIC POWER+0.21%0.1% of the index
- DDOMINION ENERGY INC+0.22%0.1% of the index
And 25 more: 20 rose and 4 fell, 1.2% of the index together.
Open Utilities on the boardReal Estate19 of 30 rose, 1.8% of the index-0.09%
- WELLWELLTOWER INC-0.19%0.3% of the index
- PLDPROLOGIS INC+0.10%0.2% of the index
- EQIXEQUINIX INC-1.77%0.2% of the index
- AMTAMERICAN TOWER CORP+0.98%0.1% of the index
- SPGSIMON PROPERTY GROUP INC-0.27%0.1% of the index
- DLRDIGITAL REALTY TRUST INC-1.89%0.1% of the index
And 24 more: 17 rose and 7 fell, 0.9% of the index together.
Open Real Estate on the boardMaterials12 of 24 rose, 1.7% of the index-0.17%
- LINLINDE PLC+0.69%0.4% of the index
- NEMNEWMONT CORP+0.45%0.2% of the index
- FCXFREEPORT MCMORAN INC-2.00%0.1% of the index
- SHWSHERWIN WILLIAMS CO/THE-0.20%0.1% of the index
- ECLECOLAB INC+1.60%0.1% of the index
- APDAIR PRODUCTS + CHEMICALS INC+0.11%0.1% of the index
And 18 more: 8 rose and 9 fell, 0.7% of the index together.
Open Materials on the board
Each tile is sized by its weight in the index and filled by its move on the session. 503 of 503 members priced from the two files.
How many members moved with the index
Session of Friday, November 13, from the holdings files published the next morning
On Friday, November 13, 314 of 503 S&P 500 members rose and 185 fell, 4 unchanged; the average member moved +0.13% against the index's -0.40%.
Advance-decline line, S&P 500
21 sessions from October 16; the running total of advancers less decliners is +669.
The average member against the index
+0.13%
equal weight
-0.40%
cap weight
314 rose, 185 fell, 4 unchanged, of 503 members.
Share of members up, by sector
Large, mid and small companies
- S&P 50062% up, avg +0.13%
- S&P MidCap 40056% up, avg +0.03%
- S&P SmallCap 60056% up, avg +0.09%
- S&P Composite 150058% up, avg +0.09%
The tick marks half. The 1500 is the three together, each member counted once.
Above their averages, and at highs and lows
On Friday, November 13, 64% of S&P 500 members closed above their 200 day average and 71% above their 50 day average; 23 closed at a 52 week high and 3 at a 52 week low.
- S&P 500Friday, November 13
- Above 20 day67%
- Above 50 day71%
- Above 200 day64%
23 at a 52 week high and 3 at a 52 week low, of 500 members with a year of closes.
- S&P MidCap 400Friday, November 13
- Above 20 day59%
- Above 50 day60%
- Above 200 day52%
7 at a 52 week high and 3 at a 52 week low, of 396 members with a year of closes.
- S&P SmallCap 600Friday, November 13
- Above 20 day52%
- Above 50 day54%
- Above 200 day53%
5 at a 52 week high and 9 at a 52 week low, of 597 members with a year of closes.
- Russell 1000Friday, November 13
- Above 20 day62%
- Above 50 day64%
- Above 200 day56%
34 at a 52 week high and 8 at a 52 week low, of 1001 members with a year of closes.
- Russell 2000Friday, November 13
- Above 20 day46%
- Above 50 day44%
- Above 200 day46%
21 at a 52 week high and 113 at a 52 week low, of 1888 members with a year of closes.
Measured on closing prices for Friday, November 13. A member with too few sessions for an average is left out of that measure and not counted as below it. S&P 500: the 200 day average covers 500 of 503 members, the rest having too little history; 2 left out while a split is checked. S&P MidCap 400: the 200 day average covers 396 of 398 members, the rest having too little history; 2 of 398 had no close for the session. S&P SmallCap 600: the 200 day average covers 598 of 603 members, the rest having too little history; 1 left out while a split is checked. Russell 1000: the 200 day average covers 1003 of 1021 members, the rest having too little history; 1 of 1021 had no close for the session; 5 left out while a split is checked. Russell 2000: the 200 day average covers 1900 of 1956 members, the rest having too little history; 7 of 1956 had no close for the session; 11 left out while a split is checked. History before the first stored membership file is built from the members listed on that file. Closes from iShares (BlackRock) holdings files and Yahoo Finance; the closes themselves are not republished.